July 2022

There were no surprises in the first full month of summer in terms of real estate activity, as the year-over-year normalizing of buyer demand experienced during the first two quarters of the year continued throughout the country.
“’The year-over-year dip in buyer activity follows a general market rebalancing that’s taking place across the country as available inventory increases while fewer buyers actively shop for homes. Both factors have eased competition compared to last summer’s multiple-offer environment,’ said Mike Lane, vice president of sales and industry for ShowingTime+.
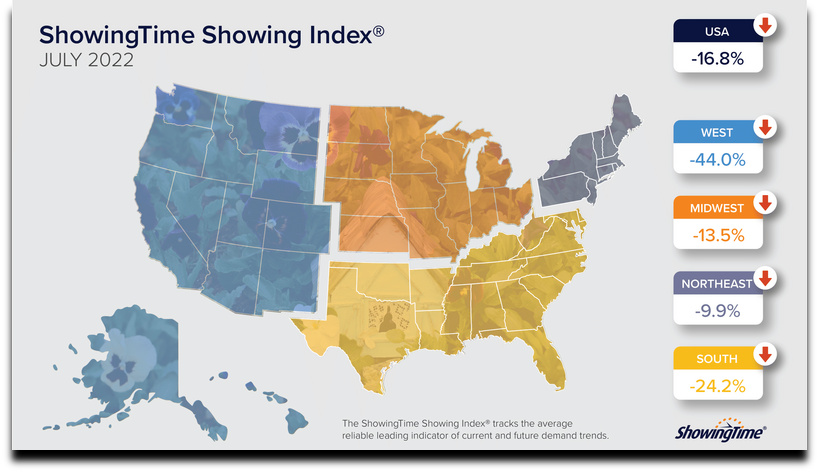
The Northeast again saw the smallest dip in buyer demand in July, recording a 9.9% drop, followed by the Midwest’s 13.5% decrease. The South’s 24.2% drop came next, with the West again claiming the largest year-over-year decline at 44%. The U.S. overall saw a 16.8% dip in showing traffic in July.
Burlington, Vt. again led all markets in showings per listing with an average of 12.1, marking the third consecutive month it claimed the top spot. Burlington was one of only four markets in the top 25 to see a year-over-year increase in the number of showings per listing, with Hartford, Conn., Appleton, Wis., and Syracuse, N.Y., also seeing modest increases.
Trenton, N.J., recorded an unusual month-over-month increase of 4%, the only market in the top 25 with a gain in traffic compared to June. Among the top 50 busiest markets, just two other cities, El Paso
August 2022

Full recap: August 2022 Showing Index Results: End of Summer Sees Continued Slowdown of Home Showing Activity
Home showing activity again saw a slowdown in August, albeit at a pace that gave indication that the year-over-year dips were finally beginning to level off.
“Home showing traffic is returning to earth in line with the market’s rebalancing from the record-breaking highs brought on by the pandemic. Obstacles to affordability have meant less competition and more homes for sale, giving home shoppers more time and options.
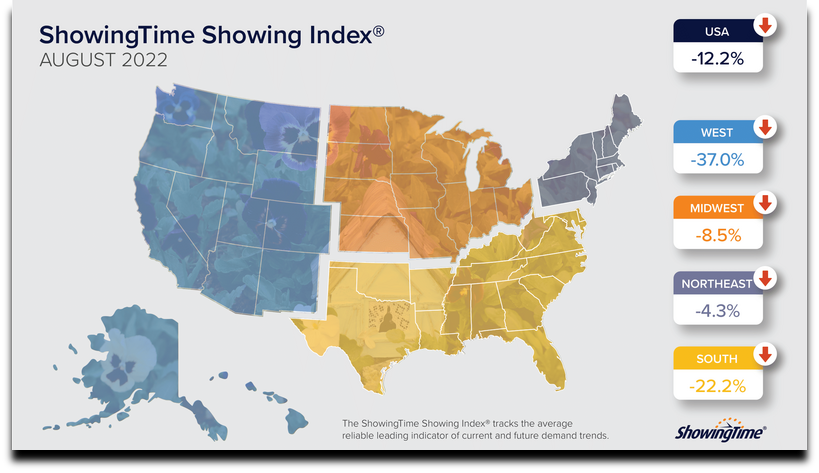
The West and Northeast regions experienced slight pickups in showing activity with the first month-over-month increases since January and April, respectively. The South and Midwest regions each saw small monthly decreases in August.
‘The more moderate pace at which home showings are slowing down and the increase in markets that saw more showings per listing this month are signs that the market may be starting to find a new balance,’ said Mike Lane, vice president of sales and industry for ShowingTime+. ‘Buyers will continue to see less competition for homes and have more time to tour homes they like and consider their options.’”
September 2022

Concerns about affordability affected buyer demand in September, even in the face of a downturn in home prices throughout the summer.
“Affordability remains a major challenge for home shoppers, despite recent moderate price declines and an increase in the number of homes for sale from this time last year. Mortgage affordability challenges combined with normal seasonal slowdown — showing traffic is down 7% from last month, in line with previous years — mean fewer buyers are engaging in home showings.
‘In addition to the regular seasonal slowdown we would expect, buyers who can’t overcome affordability challenges are opting out of the market and contributing to the fewer showings we saw in September,’ said Mike Lane, vice president of sales and industry for ShowingTime+.
‘At inflection points like this, while it’s difficult to forecast what will happen, we continue to believe that fall showing activity remains a leading indicator of spring market conditions. September’s data hints at inventory challenges continuing into next year,’ Lane said.
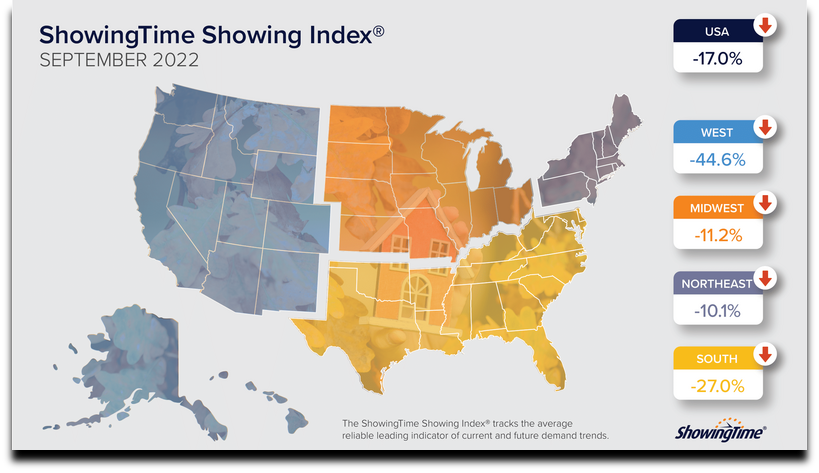
All regions and the U.S. as a whole saw monthly and yearly declines in showing traffic. The Midwest and Northeast regions saw year-over-year declines of 11.2% and 10.1%, respectively. The South is down 27% from last year, while the Western region again led all regions in year-over-year declines, with a drop of 45%. The West and South are home to previous red-hot pandemic markets, including Seattle, Denver, Austin and Phoenix.”
A look at what’s to come: For the latest Showing Index updates, be sure to subscribe to our blog. You can also view localized showing data at the state/province level, updated daily, in our daily showing activity tracker by clicking here.
ShowingTime+ services help agents representing buyers and sellers alike. Whether you already use ShowingTime as an MLS/association feature and are considering an upgraded level of service, or you’re new to the ShowingTime+ ecosystem and want to learn more about our offerings, our dedicated Sales Team is available to discuss your business needs. Click the button below to reach out to them today.


