Perhaps you already checked it out and collected valuable insights about your market. But if the report’s arrival went unnoticed, squeezed between many other tasks competing for your attention, let’s dive in and explore how you can take advantage of the detailed report – we all know data is as good as the story it tells!
First, where can you find your Annual Report?
Log in to InfoSparks through your MLS portal as you usually do. At the top in the header menu ribbon, click on FastStats drop-down menu (or the Reports tab in some markets), then select Annual Report.
How do you read the Annual Report?
If you’re familiar with other FastStats PDF reports, you’ll recognize the layout of the Annual Report. Whether you prefer to analyze information in text form or by viewing infographics, you’ll find that the Annual Report has something for everyone. The introductory text outlines the big picture view concisely so that you can incorporate the analysis into your own client conversations or social media posts.

Next, scroll to infographics to focus on the at-a-glance details of many different metrics.
An agent favorite is the breakdown between the top and the bottom five markets. As an experienced REALTOR®, you already have great insight into the local areas in your market, but imagine being able to tell your sellers that they should expect their property to stay on the market for 81 days and have 11 showings before it goes to pending. Also, when talking about whether to accept an offer, you can quickly check the percentage of the list price median for that area and then check the change trends. Bingo! All the guesswork is taken out of this difficult decision.
Let’s look at an example

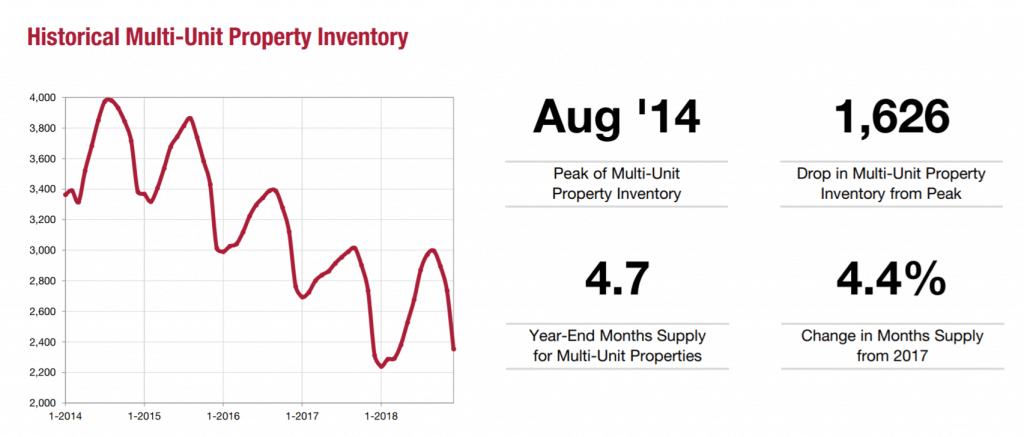
Let’s take a look at multi-unit properties: Market X (above image) shows an increase in the inventory compared to the previous year (which was 3.7), while Months Supply also changed from negative trend to a positive 4.4 percent. If we look at the year-over-year trend we can notice that this downward trend seems to be reversing itself this year. As the inventory and sales prices often correlate, it’s interesting to note that there’s no change in the percentage of original price received with a slight influx of multi-unit properties on the market.

Now let’s say you have a buyer who’s really interested in investing in multi-unit properties. By quickly scanning the list of areas you can see the hottest markets worth investing in right now.
To add the final piece, look at median sale price for each area. Depending on the neighborhood specifics, the average sales price metric might provide value as well. Looking at both these price metrics will help better define what’s within your client’s budget.

The bottom line
The times are changing. More and more information is available online. All parties involved in a real estate transaction can find trends and statistics using tools widely available across platforms. But when it comes to buying or selling a home most consumers turn to an experienced REALTOR®. When we ask buyers and sellers what they are looking for in their agent, 64 percent said it’s trustworthiness and knowledge of the local market (Source: National Association of REALTORS® 2017 Profile of Home Buyers and Sellers). Tools like MarketStats’ Annual Report helps agents project that confidence, supported by accurate, dependable data.
Looking at the bigger picture
If you want to see how previous years fared compared to the current year, select the time-frame from the Time Period drop down menu, which can date as far back as 2011 (varies per market). The Table of Contents will help you jump to different overviews: Property Types, Distressed Properties, Multi-Units, etc.
Do you have the market statistics you need at your fingertips?
If you’re a real estate professional and belong to an MLS that subscribes* to MarketStats by ShowingTime, you already have access to useful reports and charts for every situation.
For MLS and association staff who need to quickly generate reports and charts that summarize local market activity, MarketStats by ShowingTime can help. Contact us for more information.
*MLSs and associations subscribe to MarketStats by ShowingTime to provide ready-made statistical tools for members. MarketStats is currently sold only to MLSs or associations.


