ShowingTime Blog – Product
Tips and tricks for ShowingTime subscribers looking to get the most out of our showing management and market stats offerings.
Exploring the InfoSparks Monthly Indicators Report
One of our most thorough InfoSparks reports, available within the MarketStats products in some markets, the Monthly Indicators report is a powerful tool to help you master your market. This report fills 13 pages with key metrics and insights to highlight current market trends.
Using the FastStats Local Market Updates Report
Those of you who receive FastStats PDF reports are probably familiar with many of them. Our most concise report, the Local Market Updates, fits on a single page and allows you to quickly assess key metrics for a neighborhood, city or county (available in some markets).
Using InfoSparks to Handle Tough Conversations with Home Sellers
As every agent knows, sometimes a new coat of paint, a deep clean or the scent of freshly baked cookies aren’t enough to position a house to sell. Sometimes a seller needs an agent’s deep knowledge of the latest market information to help them understand and adapt to market realities. That’s where InfoSparks comes in.
5 Things You Can Do with MarketView Broker
MarketView Broker serves as a valuable recruiting tool for real estate broker/owners, but that’s only the start of what the browser-based analytics tool can do.
InfoSparks Insights: Set It & Forget It with Live Charts
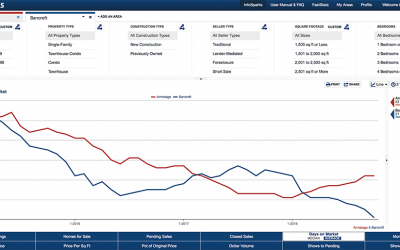
InfoSparks allows real estate agents to create their favorite charts using live data and share them via email and social media using a link that can also be bookmarked and pulled up whenever you need to access to them.


